Monitoring a Failover Manager cluster v4
You can use either the Failover Manager efm cluster-status command or the PEM Client interface to check the current status of a monitored node of a Failover Manager cluster.
Reviewing the cluster status report
The efm cluster-status cluster properties file command returns a report that contains information about the status of the Failover Manager cluster:
# efm cluster-status <cluster_name>
The following status report is for a cluster named edb that has three nodes running:
Agent Type  Address               Agent   DB        VIP
-----------------------------------------------------------------------
Standby     172.19.10.2            UP     UP        192.168.225.190
Standby     172.19.12.163          UP     UP        192.168.225.190
Primary     172.19.14.9            UP     UP        192.168.225.190*


Allowed node host list:
172.19.14.9 172.19.12.163 172.19.10.2


Membership coordinator: 172.19.14.9


Standby priority host list:
172.19.12.163 172.19.10.2

Promote Status:

DB Type  Address         WAL Received LSN   WAL Replayed LSN   Info
--------------------------------------------------------------------
Primary  172.19.14.9                        0/4000638
Standby  172.19.12.163   0/4000638          0/4000638
Standby  172.19.10.2     0/4000638          0/4000638


Standby database(s) in sync with primary. It is safe to promote.
The cluster status section provides an overview of the status of the agents that reside on each node of the cluster:
Agent Type  Address             Agent   DB        VIP
-----------------------------------------------------------------------
Standby     172.19.10.2          UP     UP        192.168.225.190
Standby     172.19.12.163        UP     UP        192.168.225.190
Primary     172.19.14.9          UP     UP        192.168.225.190*
The asterisk (*) after the VIP address indicates that the address is available for connections. If a VIP address is not followed by an asterisk, the address was associated with the node in the properties file, but the address isn't currently in use.
Failover Manager agents provide the information displayed in the Cluster Status section.
The Allowed node host list and Standby priority host list provide an easy way to see the nodes that can join the cluster and the promotion order of the nodes. The IP address of the membership coordinator is also displayed in the report:
Allowed node host list:
172.19.14.9 172.19.12.163 172.19.10.2
Membership coordinator: 172.19.14.9
Standby priority host list:
172.19.12.163 172.19.10.2
The Promote Status section of the report is the result of a direct query from the node on which you are invoking the cluster-status command to each database in the cluster. The query also returns the transaction log location of each database. Because the queries to each database return at different times, the LSNs might not match even if streaming replication is working normally for the cluster. To get the latest view of replication, connect to the primary database, and execute SQL command SELECT * FROM pg_stat_replication;.
Promote Status:

DB Type  Address         WAL Received LSN   WAL Replayed LSN   Info
-------------------------------------------------------------------
Primary   172.19.14.9                       0/4000638
Standby  172.19.12.163   0/4000638          0/4000638
Standby  172.19.10.2     0/4000638          0/4000638
If a database is down or if the database was restarted, but the resume command was not yet invoked, the state of the agent that resides on that host is idle. If an agent is idle, the cluster status report includes a summary of the condition of the idle node. For example:
Agent Type Address Agent DB VIP
-----------------------------------------------------
Idle 172.19.18.105 UP UP 172.19.13.105
Exit codes
The cluster status process returns an exit code based on the state of the cluster:
An exit code of
0indicates that all agents are running, and the databases on the primary and standby nodes are running and in sync.A nonzero exit code indicates that there is a problem. The following problems can trigger a nonzero exit code:
A database is down, unknown, or has an idle agent.
Failover Manager can't decrypt the provided database password.
There's a problem contacting the databases to get WAL locations.
There's no primary agent.
There are no standby agents.
One or more standby nodes aren't in sync with the primary.
Monitoring streaming replication with Postgres Enterprise Manager
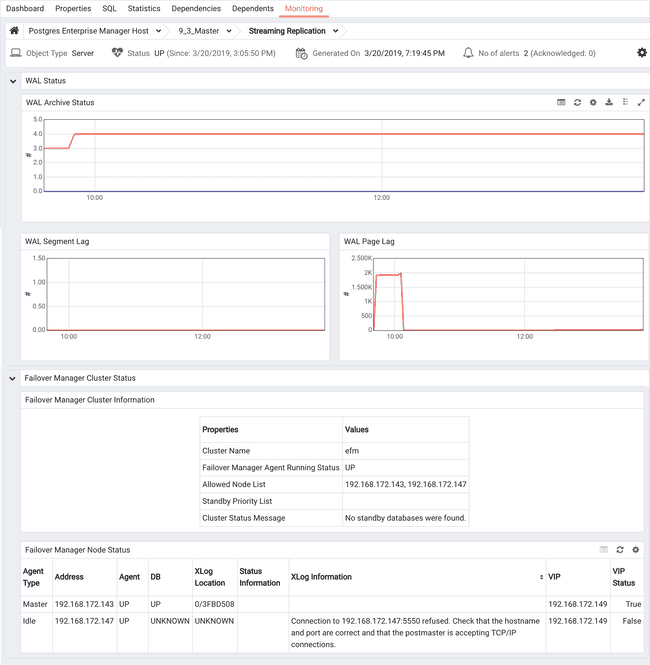
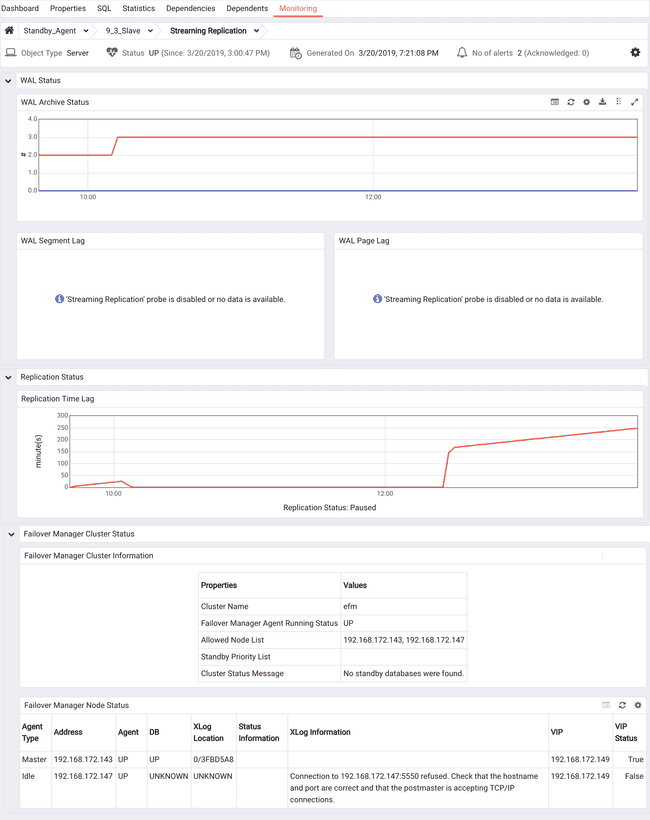
If you use Postgres Enterprise Manager (PEM) to monitor your servers, you can configure the Streaming Replication Analysis dashboard (part of the PEM interface) to display the state of a primary or standby node that is part of a Streaming Replication scenario.

The Streaming Replication Analysis dashboard displays statistical information about activity for any monitored server on which streaming replication is enabled. The dashboard header identifies the status of the monitored server (either Replication Primary or Replication Slave) and displays the date and time that the server was last started, the date and time that the page was last updated, and a current count of triggered alerts for the server.
When reviewing the dashboard for a Replication Slave (a standby node), a label at the bottom of the dashboard confirms the status of the server.

By default, the PEM replication probes that provide information for the Streaming Replication Analysis dashboard are disabled.
To view the Streaming Replication Analysis dashboard for the primary node of a replication scenario, you must enable the following probes:
- Streaming Replication
- WAL Archive Status
To view the Streaming Replication Analysis dashboard for the standby node of a replication scenario, you must enable the following probes:
- Streaming Replication Lag Time
For more information about PEM, see the Postgres Enterprise Manager documentation.